Showing posts with label wcydwt. Show all posts

Friday, April 10, 2015

What Can You Do With This? feat. Phineas and Ferb

I love the "What Can You Do With This?" variety of problem prompts: give the students a situation, photo, video, sound, or piece of equipment and then ask them: "what can you do with this?" That is, "what questions can you ask of this?"

Students have great ownership of these questions, and must really engage with the modeling process - identifying what principles apply, making and justifying assumptions and approximations, determining what information is available, etc., as well as practicing the process of asking interesting but focused and answerable questions. None of these purposes are served well by "textbook problems," not to mention that the process is more enjoyable and engaging for students when they're such a big part of it.

Here's my most recent - a video prompt that I saw while watching Phineas and Ferb with my son:


The students came up with some great questions, made measurements (including scaling) from the video, and did their analyses. It took about 35 minutes, and here are the three whiteboards from this section:
"What's the stiffness constant of the 'trampoline'"?
"What would his maximum acceleration be as he's caught?"

 "What's the maximum force exerted on him by the trampoline?"
Also explored by this group, but not pictured: "From how high could he fall and not die?"

 "How high does Phineas bounce?"
"How much energy was lost during the bounce?"

Monday, December 2, 2013

Independent Friction Labs and Another Capstone Project

I have my Honors Physics students prepare small electronic posters for their final lab of the first term, the Independent Friction Lab. In this lab, students have to come up with an experiment, make an informal proposal, execute the experiment, and analyze the results.

The experiment really just needs to have something to do with friction, and I get a wide variety of them. I have them create a single PP or similar slide, sized 24"x18"; they're great to print at Staples. I ask them to email me a draft a day or so before the presentations, and they present the revised projects.
Here are a few of this year's experiments:

This group used a Pasco friction cart; they let it slide on a cart track, used the velocity graph to determine the coefficient of kinetic friction, and then determined the hanging mass that would pull the friction cart at constant speed (verifying that with another motion detector graph).

This group found the coefficient of static friction between a block and a ramp in a neat way: they used a half-Atwood setup, changing the mass until the block slipped, but performed that experiment at several angles. They then predicted a function for that maximum mass as a function of the block's known mass, the angle, and the unknown friction coefficient. Graphing their data, Logger Pro found the static friction coefficient by regression, providing both a quality value and confirmation of the model that they used to describe the situation.

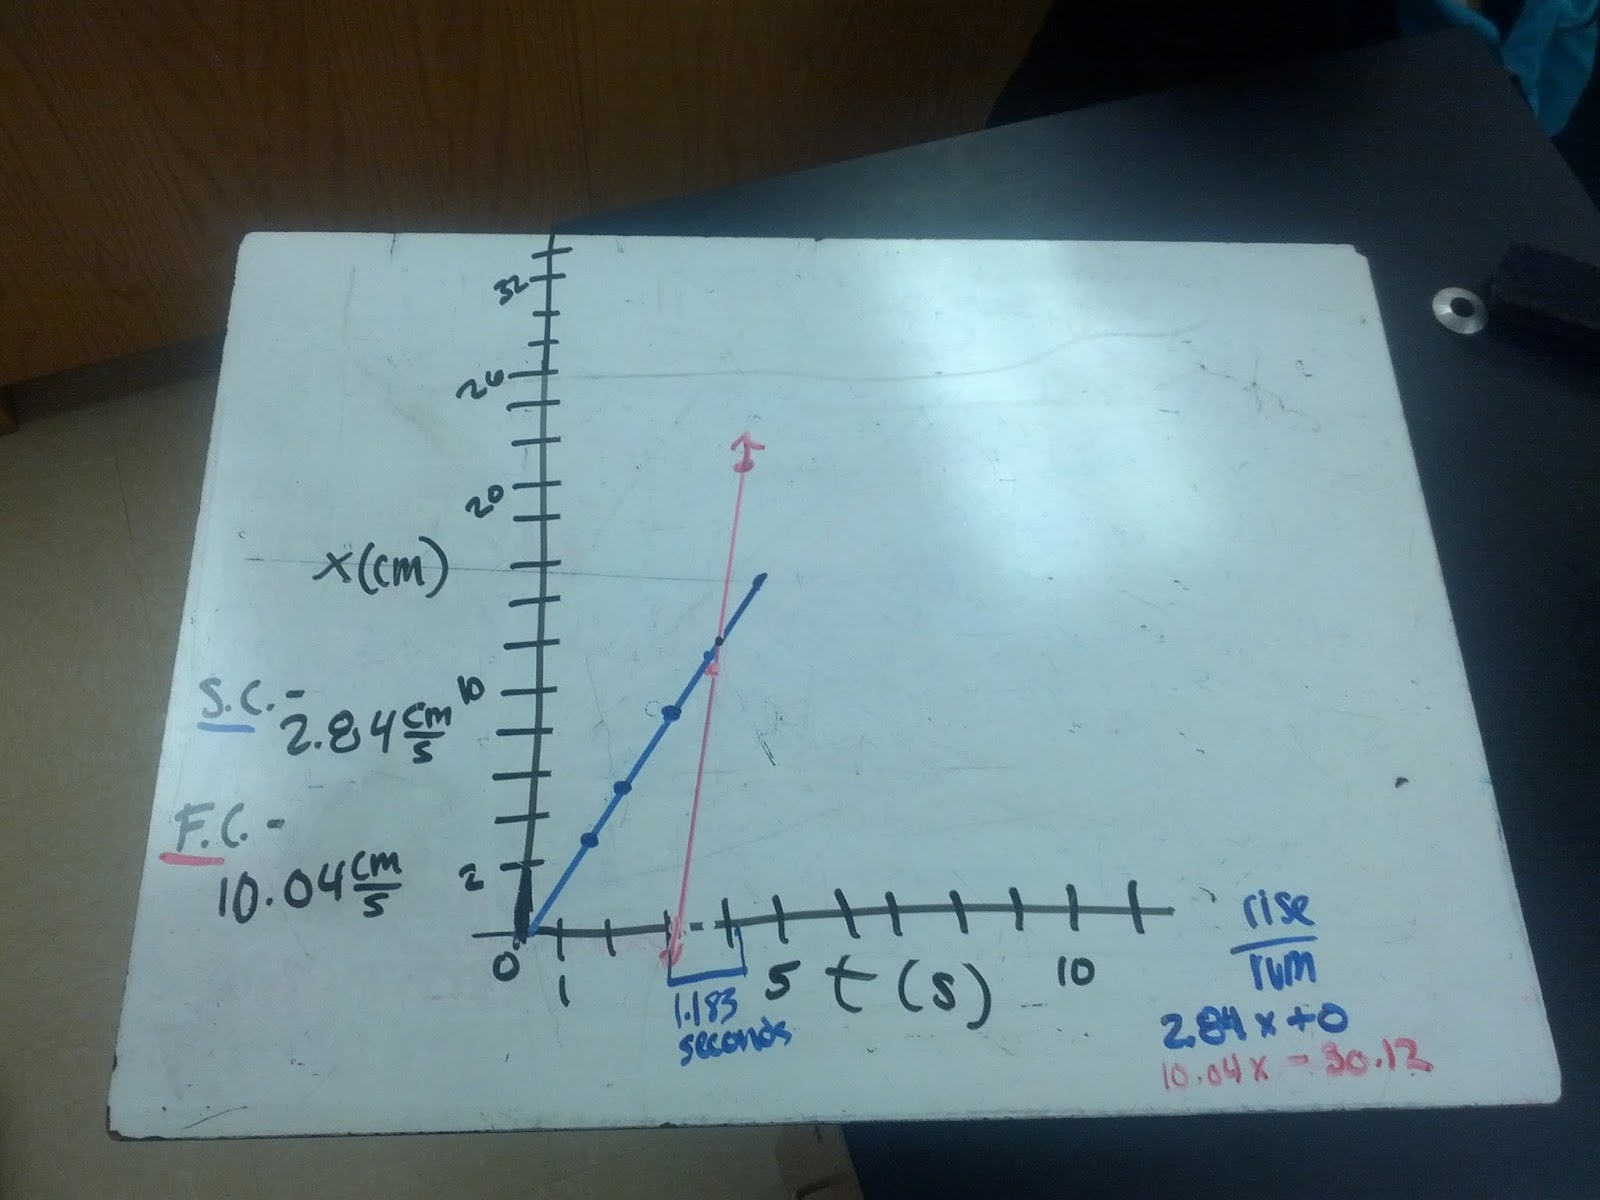
These students compared the effective coefficients of friction for a ball rolling (without slipping) and the same ball under backspin (backspin persists until it turns around). They're essentially determining the coefficients of rolling and kinetic friction, showing that the kinetic friction coefficient's much larger.

This one seems to come up every year, and it's always fun. They used video analysis to determine the coefficient of kinetic friction between socks and several surfaces. The tricky unseen part is the big possible variation in normal force from foot to foot and moment to moment

A second AP Physics capstone project is also included here; the student was trying to model the interaction between a hockey stick and a puck. It ended up being a very difficult problem, but he gained some valuable ground and ended up with a functional scaled-back model.

Student work:

For my capstone project, I wanted to model the interaction between the blade of a hockey stick and the puck during a shot or pass in ice hockey. Using the ball and spring model of matter interactions, I created a VPython program where a constant force acts on the blade of the stick, but reverses direction at the center (0,0,0) to simulate the slowing down of the stick after reaching the midpoint where the x component of the force on the stick would be at its maximum. The force on the puck, however, does not follow the same constant pattern. Since materials act like springs with miniscule stretches, the force on the puck oscillates during the entire blade-puck interaction time even though the oscillation and resulting compression of the blade would be impossible to see with the naked eye. While this is not a perfect model since the blade remains at a constant angle, 90°, and the force magnitude remains constant in the direction of velocity and only changes direction by 180°, it does illustrate how matter interacts at the atomic scale. During the collision, both the force on the puck and the compression of the blade oscillate, but so slightly with the large spring constant that, looking at the velocity graph, the puck behaves like it would with a constant force and constant acceleration during contact. 


Screenshot at the moment of collision

Graphs of the "spring" compression, force exerted on the puck, and velocity of the puck as functions of time

from __future__ import division
from visual.graph import*
from visual import*

#create objects
h=.025
puck=cylinder(pos=(1,0,0),radius=0.038, height=h, axis=(0,h,0), mass=.17, velocity=vector(0,0,0))


l=.76
R=vector(0,((2l)**2-puck.radius**2)**.5,0)
l=.02
beginpos=vector(puck.pos.x+puck.radius+l/2,puck.height,0)


stick=box(pos=beginpos, length=l, height=.076, width=0.3175, material=materials.wood, velocity=vector(0,0,0), mass=.7,)# axis=norm(R-beginpos)*.076, k=500000)

#R=vector(0,((2l)**2-stick.pos.x**2)**.5,)


scene.autoscale = False

#create forces

Fdirection=vector(-1,0,0)#norm(vector(-stick.axis.y, stick.axis.x,0))

Fmag=200

k= 10000#310575#414172.6


r=puck.pos+vector(puck.radius, puck.height/2,0)-stick.pos

s=stick.length/2-(stick.pos.x-puck.pos.x-puck.radius)  #stick.height/2-(r.mag)*cos(arctan(abs(stick.axis.y/stick.axis.x)))

Fp=vector(k*s*Fdirection)

Fs=Fmag*Fdirection


#graph
gd =gdisplay(x=0, y=0, width=600, height=150, title='Fp vs. t', xtitle='t (s)', ytitle='Fp (N)', foreground=color.black, background=color.white, xmax=.25, xmin=0, ymax=100, ymin=-100)

Fpg=gcurve(color=color.red, gddisplay=gd)


gd2 =gdisplay(x=0, y=0, width=700, height=150, title='compression vs. t', xtitle='t (s)', ytitle='Compression (m)', foreground=color.black, background=color.white, xmax=.25, xmin=0, ymax=.01,ymin=-.005)

sg=gcurve(color=color.green, gdisplay=gd2)

vg = gdisplay(x=0, y=0, width=600, height=150, title='v vs. t', xtitle='t (s)', ytitle='Puck Velocity (m/s)',foreground=color.black, background=color.white, xmax=.25, xmin=0, ymax=0,ymin=-30)
            

vg=gcurve(color=color.blue, display=vg)

print s
#create loop

t=0
dt=.00001

while t<.25:

    rate(10000)

    if s>0 and stick.pos.x>0:
        
        #stick 

        stick.velocity.x=stick.velocity.x+Fs.x/stick.mass*dt

        stick.pos.x=stick.pos.x+stick.velocity.x*dt

   #     R=vector(0,((2*l)**2-stick.pos.x**2)**.5,0)

#        stick.axis=norm(R-stick.pos)*stick.length

        #puck

        puck.velocity.x=puck.velocity.x+Fp.x/puck.mass*dt

        puck.pos.x=puck.pos.x+puck.velocity.x*dt

        #s

        r=puck.pos+vector(puck.radius, puck.height/2,0)-stick.pos

        s=stick.length/2-(stick.pos.x-puck.pos.x-puck.radius)  #stick.height/2-(r.mag)*cos(arctan(abs(stick.axis.y/stick.axis.x)))

        Fdirection=vector(-1,0,0)#norm(vector(-stick.axis.y, stick.axis.x,0))

        Fp=vector(k*s*Fdirection)

        Fs=Fmag*Fdirection-Fp


    elif stick.pos.x>0:
        #stick 

        stick.velocity.x=stick.velocity.x+Fs.x/stick.mass*dt

        stick.pos.x=stick.pos.x+stick.velocity.x*dt

#        R=vector(0,((2*l)**2-stick.pos.x**2)**.5,0)

#        stick.axis=norm(R-stick.pos)*stick.length

        #puck

        puck.velocity.x=puck.velocity.x+Fp.x/puck.mass*dt

        puck.pos.x=puck.pos.x+puck.velocity.x*dt

        #s
        r=puck.pos+vector(puck.radius, puck.height/2,0)-stick.pos

        s=stick.length/2-(stick.pos.x-puck.pos.x-puck.radius)  #stick.height/2-(r.mag)*cos(arctan(abs(stick.axis.y/stick.axis.x)))

        Fdirection=vector(-1,0,0)#norm(vector(-stick.axis.y, stick.axis.x,0))
        Fp=vector(k*s*Fdirection)

        Fs=Fmag*Fdirection

    elif stick.pos.x<0: abs="" arctan="" cos="" fdirection="vector(1,0,0)#norm(vector(-stick.axis.y," fp.x="" fp="vector(k*s*-Fdirection)" fs="Fmag*Fdirection" if="" puck.height="" puck.pos.x="puck.pos.x+puck.velocity.x*dt" puck.velocity.x="puck.velocity.x+Fp.x/puck.mass*dt" puck="" r.mag="" r="puck.pos+vector(puck.radius," s="stick.length/2-(stick.pos.x-puck.pos.x-puck.radius)" stick.axis.x="" stick.axis.y="" stick.axis="norm(R-stick.pos)*stick.length" stick.height="" stick.pos.x="stick.pos.x+stick.velocity.x*dt" stick.pos="" stick.velocity.x="stick.velocity.x+Fs.x/stick.mass*dt">0:
            Fp.x=0


        if stick.velocity.x>0:
            stick.velocity.x=0

        if s<0: abs="" arctan="" cos="" else:="" fp.x="" fpg.plot="" pos="(t," pre="" print="" puck.pos.x="puck.pos.x+puck.velocity.x*dt" puck.velocity.x="" puck.velocity="" r.mag="" s="" sg.plot="" stick.axis.x="" stick.axis.y="" stick.height="" stick.velocity.x="" t="t+dt" vg.plot="">

Wednesday, September 11, 2013

A New Twist on the Buggy Lab

I usually do the CVPM buggy lab as a WCYWDT? (What Can You Do With This?) challenge. Here's what that looks like:

  • Each group gets a slow and a fast cart (this year, I'm using the Scribbler 2 robots, along with Matt Greenwolfe's software)
  • Each group has to come up with a unique question - they put the carts into a situation and then make some prediction. Common ones include: "If they start a meter apart, where/when will they collide?" and "How much of a head start (time or distance) does the slow one need in order for the race to be a tie?"
  • Groups take data, using only one cart at a time (no testing before the big reveal!)
  • Groups create position vs. time graphs to answer their questions
  • Along the way, I ask some questions to be sure that they're framing speed correctly (m/s vs. s/m), that they're really representing their situation with the graph (if they don't start at the same place, then they shouldn't on the graph, either), etc.
  • They test their predictions, in front of everyone. These always go well, and I think that the inherent slowness of the Scribblers makes them more dramatic and easier to discern whether the test worked or not.
Here's the new part:
  • As they're finishing up their whiteboards, I have them bracket the answer to the question on their graph - if they're predicting a distance, then they need to show where that distance interval is located on the graph. If it's a time interval, then they need to bracket that, etc.
  • Students do not write their questions on the boards
  • The "presentation": students show their WBs, saying nothing. It's the rest of the class's job to figure out exactly what their situation was and what they were trying to find.
Here's why:
  • Some students have trouble differentiating between a fast car and a slow one and between a race and a head-on collision at this early stage. Having had to go through that process when they drew their graphs, they now get a few more chances to practice those skills immediately after that first experience.
  • Lots of students have difficulty locating different quantities on their graphs. In CVPM, it's not nearly as big a deal, but lots can go off of the rails when trying to find delta v or the final velocity or the displacement, etc. when we get to CAPM, so this is working on those skills early and explicitly.
  • It keeps the viewers actively engaged, much like the mistake game or other similar strategies.
Here are a few examples from today. I really like the fourth on, because the time interval that they were looking for was not starting at zero, but instead from when the second cart started. That's the sort of thing that often trips students up, even if they've drawn a correct graph to begin with.


Friday, June 21, 2013

Relative Velocity and Shaky Cams

I'm working on some of the first few days in AP C next year, and we're doing relative velocity then. I don't really have time to do it in Honors these days, and the AP kids certainly get on top of it very quickly, so I can really put it to bed in about a day with them if I wait, instead of needing a little more time the year before and then taking some time to do some review applications in the second year.

Anyway, here's my progression for that day (95 minutes):
  • Frame the need with a video. I made this shaky-cam video of a ball rolling on a table (click through to see video). The motion's certainly odd, with direction changes that seem strange. I only show this one at full speed. Update: here's a link to the video.
  • We use Logger Pro to track and model the motion, and the position graphs definitely look weird. Point out to them during the process that they can get a sense for how the speed is changing by looking at the sizes of the blurs. Speed and direction are changing, and (maybe) they won't be able to pick out the underlying motion at this point. 
  • Now that we know that there's an issue to be solved and they have discussed the differences between looking at the motion from the camera's POV and the table's POV, I introduce an easier question to tackle, Dan Meyer's escalator/stair video, which they develop a method to solve pretty easily and successfully (though not super-quickly, with the data-taking and wringing of hands about distances and natural units):
  • If we are to apply this model to the first problem to determine what the motion really was, we can add calculated columns in Logger Pro to un-shake the motion and determine what type of motion it really was. Scaling the video (ball diameter is 3.3 cm) lets you calculate initial v and angle, acceleration, etc. as well, if you're into that sort of thing.
I want to seed the concept early and revisit it a few times during the term, so that going to the center-of-mass reference frame for collisions isn't as much of an abstract stretch as it could be.

Monday, January 14, 2013

Pick a Fight!

Well, not really, but maybe a "physics fight"...

We had a friendly competition with a neighboring school today and Friday via Skype:
  • Each school checked out a clip of "Despicable Me" this week (about four minutes, dealing with the rocket trip to the moon, the shrinking of the moon, and the trip back) and was challenged to model, debunk, predict, verify, etc. whatever they could. My class spent 90 minutes on this, and I think that the other school did about the same. 
  • I didn't give them any help or direction, except for telling the name of some new concept that they wanted, so that they could effectively index/Google on their own (terminal velocity, energy-mass equivalence, and shear strength came up)
  • Each problem was whiteboarded, and we took pictures of the boards (some of theirs had nice electronic presentations, though). 
  • Today we Skyped and took turns: 10 minutes of presentation followed by 7 minutes of questions. 
It's not really a competition, but it's fun to frame it that way, since they're used to having long-standing rivalries in sports against local schools.

The investigations were fun, and it was great for the students to interact with each other from afar. We're also planning to trade some screencasts with intentional mistakes in them.

If you want to interject a little more fun into the WCYDWT?/whiteboarding/Mythbusting/modeling paradigm, maybe you should pick a 'fight' with a nearby school!

Here are our whiteboards, from both sections that participated:

An analysis of the speed of the spaceship (not surprisingly, too fast for reality), using the altitudes of different parts of the atmosphere for reference:

An analysis of the mass of the shrunken moon, assuming that its density stayed the same:

...using that mass, the freefall acceleration and very-low-orbit speed for the tiny moon:

Assuming that all of that missing mass was converted into energy, the ridiculously large amount that there would be:


An analysis of how the now-tiny moon would basically eliminate tides:


This class assumed that the moon's mass would stay the same, rather than its density. A proof that this would do nothing to the tides:

Assuming CAPM speeding up and slowing down, the acceleration of the spaceship and the resulting huge forces on Gru, if he is going to make it to the dance recital:


The freefall acceleration on the surface of the tiny moon:


Trying to determine Gru's speed when he hits the shrunken moon (it shrinks to be at its center of mass, so he's one moon-radius away, and then he freefalls towards it); CAPM is used, with the acknowledgment that it's not appropriate.

Assuming that he hits the moon and stops in a short distance (stomach compression), the huge normal force that would be exerted on him by the moon when he hits it:

A comparison of the pressure exerted by that huge force and the shear strength of bone, showing just how easily that moon would cut a hole straight through him (and then he'd continue past it, slowing down as he moves, then back again, in an oscillation with the moon passing through the same hole over and over... OK, physics isn't pretty).

Tuesday, November 20, 2012

Spring Wave Speed Lab

My first lab with the spring wave speed used to be a prescribed method of stretching the spring, then keeping the length the same, but not using all of the spring, using the unstretched spring amount as a stand-in for tension, etc. ... It became more about direction-following and less about understanding than I wanted, and I had to dismiss the possibilities of amplitude, etc. affecting the wave speed. At the end of it all, they still didn't have the main idea (that wave speed only depends on properties of the medium) in mind very well.

I've gone to a more open-ended WCYDWT-style lab:
"Here's a slinky: look at these cool wave pulses. What do you think might affect their speeds?"

Take down the list dutifully - this year's ideas:
First section:
- Spring tension
- Amplitude
- Carpet vs. tile floor
- Horizontal vs. vertical pulses
Second section:
- Spring stretch
- Amplitude
- Frequency (this was a fun one to test. There was a metronome involved, and it was tricky to measure the speeds of the lower frequency waves, but it was a good experience for the hearty)

They did a much better job of experimental design, whiteboarding, and presentation than in the past. I'm still having to answer too many questions/guide Socratically too much about what should be on the axes and what the order of the axes should be, but the Honors classes are much better in that regard. Time will hopefully improve this situation for both. Everybody's getting the experience of designing and analyzing, and of calculating the wave speed, too, regardless of their question.

The whiteboards:


Question Boards and Answer Boards

I've been taking pictures of student whiteboards for a while, uploading them to our online classroom on our school's website. When the problems are different, they can be a source of extra practice (complete with solutions) for students.

When the framework is WCYDWT (What can you do with this?), the problems are definitely all different, because they're generated by the students. Today, I had them shoot a launcher straight up in the air, and then they had to develop and answer a question when the launcher was at some other angle. They determined the initial velocity from the first shot, and then came up with a variety of other scenarios for the 2D shot, including simple range equation angle and distance determinations, all of the way up to firing a ball into a moving CVPM buggy.

I structured the whiteboard sharing a little differently this time, though. I had each group write up a nice solution on their big whiteboard, just like normal, but I also had them use a small whiteboard.  On the small whiteboard, they made clear what their question was and included only raw data. This is the "question" board, and the big one is the "answer" board. This makes the process of using these as practice problems more practical and more like "flying solo."

Here's an example:


Wednesday, March 14, 2012

WCYDWT? Moon

What can you do with this? There's a lot of information packed into this photo!