- Each group gets a slow and a fast cart (this year, I'm using the Scribbler 2 robots, along with Matt Greenwolfe's software)
- Each group has to come up with a unique question - they put the carts into a situation and then make some prediction. Common ones include: "If they start a meter apart, where/when will they collide?" and "How much of a head start (time or distance) does the slow one need in order for the race to be a tie?"
- Groups take data, using only one cart at a time (no testing before the big reveal!)
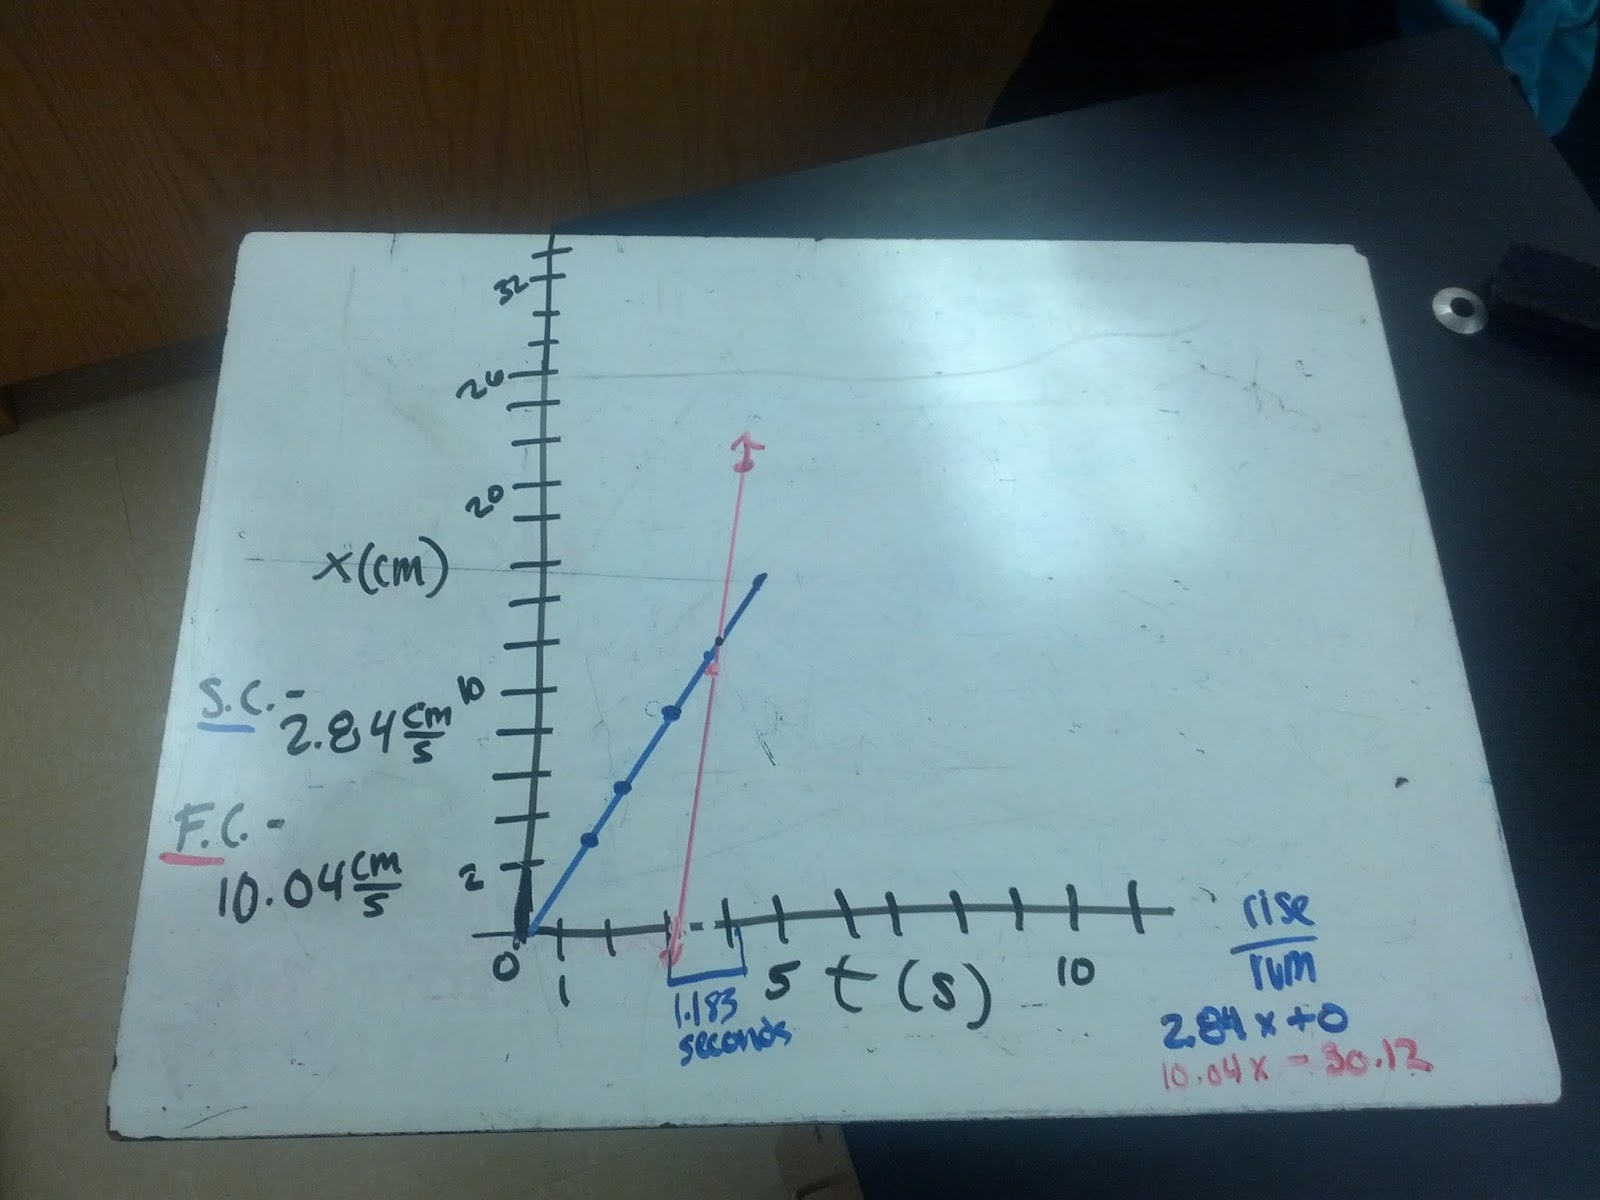
- Groups create position vs. time graphs to answer their questions
- Along the way, I ask some questions to be sure that they're framing speed correctly (m/s vs. s/m), that they're really representing their situation with the graph (if they don't start at the same place, then they shouldn't on the graph, either), etc.
- They test their predictions, in front of everyone. These always go well, and I think that the inherent slowness of the Scribblers makes them more dramatic and easier to discern whether the test worked or not.
Here's the new part:
- As they're finishing up their whiteboards, I have them bracket the answer to the question on their graph - if they're predicting a distance, then they need to show where that distance interval is located on the graph. If it's a time interval, then they need to bracket that, etc.
- Students do not write their questions on the boards
- The "presentation": students show their WBs, saying nothing. It's the rest of the class's job to figure out exactly what their situation was and what they were trying to find.
Here's why:
- Some students have trouble differentiating between a fast car and a slow one and between a race and a head-on collision at this early stage. Having had to go through that process when they drew their graphs, they now get a few more chances to practice those skills immediately after that first experience.
- Lots of students have difficulty locating different quantities on their graphs. In CVPM, it's not nearly as big a deal, but lots can go off of the rails when trying to find delta v or the final velocity or the displacement, etc. when we get to CAPM, so this is working on those skills early and explicitly.
- It keeps the viewers actively engaged, much like the mistake game or other similar strategies.
Here are a few examples from today. I really like the fourth on, because the time interval that they were looking for was not starting at zero, but instead from when the second cart started. That's the sort of thing that often trips students up, even if they've drawn a correct graph to begin with.


No comments:
Post a Comment