The Physics Teacher just published an article of mine:
A Teachable Moment Uncovered by Video Analysis
It's a whirlwind ride through a simple kinematics lab (rolling a ball down a flat track, modeling its outgoing speed as a function of its incoming speed). As it's the first lab, I want to give a good introduction to exactly what I mean by "error analysis," and it's not some weak hand-waving about 'human error' (go ahead and remove that from your vocabulary! It means nothing - that's why you always have to explain what you mean by it - and implies that non-human measurements have no uncertainty, which is flat wrong).
I have them analyze an example video of this bouncing action. The constant initial speed assumption is good, the instantaneous bounce assumption's pretty good, but the constant final speed assumption is easily belied by the position vs. time graph. Why? Friction! That sliding sounds that some of them heard (and ignored, because there wasn't a quick and easy explanation for it) was the ball changing rotation direction, at the expense of some speed. Now we know that the calculated speeds (from the time interval from impact to some other point) were uniformly fast. That's a good piece of error analysis for high school.
Monday, April 25, 2011
Friday, April 22, 2011
Making Virtual Images Real
We go through geometric optics like this:
Plane mirrors
All images are:
Convex Mirrors
All images are:
Concave Mirrors
Here, there are few absolutes. The images are real, virtual, diminished, enlarged, near, far, upright, and inverted, depending on the object location.
We do a lab that combines ray tracing and Pasco light sources, mirrors, screens, and tracks. To compare the tracing data and the experimental data (the focal lengths are different), we scale everything by the focal length (graphing M vs. d_o/f, d_i/f vs. d_o/f, etc.).
Everything goes swimmingly until they get to the virtual images in the lab. How to find the location? They're virtual because there are no light rays there, so they can't be projected.
We previously did a lab using a pane of glass (with light on one side of the room and darkness on the other); they put lab a lab weight on the light side and moved an identical weight around on the dark side until - from every viewing angle - the two lined up. That's how they knew where the image was; a single observer can only point in the direction of an image, so two are required to fix the image's location to a single point in space. Your two eyes rock at this.
So...
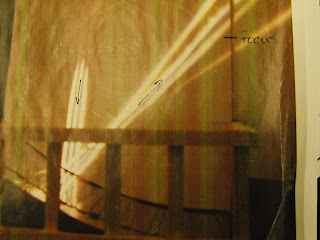
We use the same strategy here. We use the lab mirror (a 100 mm concave mirror on a stand), and a thin magic marker for the object. Moving around a second marker behind the mirror until it lines up with the image from every viewing angle will find the image location.
Can't quite picture it? I threw this video together today. Please don't laugh. Click through the thumbnail to see it!

Plane mirrors
All images are:
- virtual
- upright
- same size as the object
- the same distance behind the mirror that the object was in front of it
Convex Mirrors
All images are:
- Upright
- Virtual
- All of the images are behind the mirror, but the distance varies. The images are always between the mirror and the focus
- The images are all diminished, but the magnification depends on the object distance
Concave Mirrors
Here, there are few absolutes. The images are real, virtual, diminished, enlarged, near, far, upright, and inverted, depending on the object location.
We do a lab that combines ray tracing and Pasco light sources, mirrors, screens, and tracks. To compare the tracing data and the experimental data (the focal lengths are different), we scale everything by the focal length (graphing M vs. d_o/f, d_i/f vs. d_o/f, etc.).
Everything goes swimmingly until they get to the virtual images in the lab. How to find the location? They're virtual because there are no light rays there, so they can't be projected.
We previously did a lab using a pane of glass (with light on one side of the room and darkness on the other); they put lab a lab weight on the light side and moved an identical weight around on the dark side until - from every viewing angle - the two lined up. That's how they knew where the image was; a single observer can only point in the direction of an image, so two are required to fix the image's location to a single point in space. Your two eyes rock at this.
So...
We use the same strategy here. We use the lab mirror (a 100 mm concave mirror on a stand), and a thin magic marker for the object. Moving around a second marker behind the mirror until it lines up with the image from every viewing angle will find the image location.
Can't quite picture it? I threw this video together today. Please don't laugh. Click through the thumbnail to see it!
Wednesday, April 20, 2011
Whiteboards
Two awesome whiteboards form today - both are awesome in different ways than the usual whiteboards that we've posted here.
Whiteboard image:
This group had the idea to use the whiteboard as the image screen when trying to find the location of this image. The object was close to the focus (but behind it) of the concave mirror, so the image was real, but behind the object. They had to skew the setup to locate the image (so that the lighted object ray box wasn't in the way), and they used a whiteboard to project the image onto.

The Velocityraptor:
Kyle had the doodling urge while we were going over Kepler's laws (to be fair, he started this while we were going over an old AP problem that we had done last time: he had seen it, but half of the class hadn't). The result? Velocityraptor. Clever girl...

Tuesday, April 19, 2011
What Does That Graph Tell You? (Part I)
It's a bit of a dirty secret: students can plot points, find different trendlines on their calculators, label axes (if you harangue them) and produce graphs.
Wait, that's not the secret part. This is the secret part:
There are actually a few places to trip up here. There's hidden reasoning that you can't gloss over, if you want to really have the tools to tackle harder situations.

Let's try a bit harder one:
"The image is always the same distance behind the mirror as the object is in front of it."
There's a bit more reasoning to do here:

Are these really "simple" graphs? Well, if you think about all of the (mostly unstated) reasoning that goes into them, you start to see why they can be difficult for students. Remember that most students don't have a real understanding of what the slope, vertical or horizontal intercept, or vertical or horizontal asymptote really mean! They can draw them and point to them on the graph, but they walk into physics without much of an idea at all of what they actually tell you, much less how to translate some physical conceptual understanding into a graph by using those features of the graph - we (and they) have to put some time and effort into figuring out how these are just different representations of the same information. Once they've done that, it opens up huge new worlds and gives them tremendous reasoning power that they don't even know exist.
Wait, that's not the secret part. This is the secret part:
Many students don't know what their graphs mean!
This isn't just a problem of graph interpretation (a post for another day?), but it's a serious problem for graph construction. If you don't know what you're saying, how can you say it?
The more fundamental issue, IMHO, is that many students don't even think that graphs and diagrams and equations actually say anything!
What other explanation can there be for the number of silly graphs, diagrams, and equations that all of us teacher types see? ...did you really mean that the car is speeding up (from your acceleration and velocity vectors) and slowing down (from your values of velocity)? ...did you really mean that the object accelerates (because you drew a diagram showing unbalanced forces) and that it doesn't accelerate (because your Fnet equation = 0)? ...did you really mean that the gravitational force increases (like your graph does, uniformly) as you move away from the Earth's surface?
In most cases, I argue that the students don't really mean most of these things, but instead that they're not attributing meaning to the graphs, diagrams, and equations that we get them to draw. Why do we harp on them about these?
Graphs, diagrams, and equations are the most important and useful tools for constructing understanding, not just for communicating it.
Teachers and scientists know this, because we know how to use them, but it has to be part of the process to not only make the students draw these things, but to try to get them in situations where they have to use these in conceptually deep ways. They don't see the value until they... see the value! It's easy to give this short shrift, but it's vitally important not to. Until then, they're checking off boxes - going through the motions.
We're working with optics in physics now, so we warmed up with a couple of easy graphs: magnification (M) vs. object distance (d_o) and image distance (d_i) vs. object distance (d_o) for planar mirrors. We've ray traced and shortcut, looked at images and fields of view, figured out the necessary length for a full-length mirror, and this is a bit of a review (we've been doing convex mirrors for a couple of days) and a wrap-up in disguise.
Together, on the board (not always the best approach, but we were a little pressed for time this day), we figured out how to translate these conceptual sentences into graphs:
"The image is always the same size as the object."
There are actually a few places to trip up here. There's hidden reasoning that you can't gloss over, if you want to really have the tools to tackle harder situations.
The image is always the same size as the object.
↓
The magnification (the ratio of image height to object height) is always 1.
↓
For every value on the horizontal axis (object distance), the vertical axis (magnification) has a value of 1.
↓
The M vs. d_o graph is a horizontal line.

Let's try a bit harder one:
"The image is always the same distance behind the mirror as the object is in front of it."
There's a bit more reasoning to do here:
The image is always the same distance behind the mirror as the object is behind it.
↓
The image distance is the same "number" as the object distance.
↓
The image distance is the opposite (times -1) of the object distance, since the images are behind the mirror.
↓
For every horizontal (d_o) value, the vertical value (d_i) is the same value, but negative.
↓
If the object's right up against the mirror, so is the image, so the point (0,0) is part of the graph.
↓
The d_i vs. d_o graph is a downward sloping line (slope -1) with an intercept at the origin.

Are these really "simple" graphs? Well, if you think about all of the (mostly unstated) reasoning that goes into them, you start to see why they can be difficult for students. Remember that most students don't have a real understanding of what the slope, vertical or horizontal intercept, or vertical or horizontal asymptote really mean! They can draw them and point to them on the graph, but they walk into physics without much of an idea at all of what they actually tell you, much less how to translate some physical conceptual understanding into a graph by using those features of the graph - we (and they) have to put some time and effort into figuring out how these are just different representations of the same information. Once they've done that, it opens up huge new worlds and gives them tremendous reasoning power that they don't even know exist.
Monday, April 18, 2011
Fields: Mrs. and Electric
The electric field and electric potential are easily the most difficult subjects that I teach each year in the honors physics class. They're conceptually more difficult than anything in the AP Mechanics C class, too, I'd wager.
The root issue is that, by the time we're to electric potential, we're about two levels away from reality (energy's not real, and V is the potential energy per unit charge) and and three levels from student experience (... and all of this electron and proton business is somewhat on the small side).
Fortunately, a good study break is all we need. Let's surf on over to ohnuts.com and grab some pecans! You know, for sandies.


That's a mouthful of physics right there! We'll come back to potential on another day, but the big idea to communicate is that:
The root issue is that, by the time we're to electric potential, we're about two levels away from reality (energy's not real, and V is the potential energy per unit charge) and and three levels from student experience (... and all of this electron and proton business is somewhat on the small side).
Fortunately, a good study break is all we need. Let's surf on over to ohnuts.com and grab some pecans! You know, for sandies.
 |  |
Ah, yes... it's a tale of two pecans. Well, maybe two bags of pecans. You see, I have a bag of cinnamon pecans (bag A) and a bag of regular pecans (bag 1). Which one cost more?
...
...
...well?
That's not fair of me, of course. You don't know which cost more until I tell you the weight of each bag. The price listed on the website, then, isn't really a price - it's something more abstract. It's the price per unit weight. The "per" part, even in this mundane example, is the hard bit. We spend a whole year on "per" - it's called calculus.
Don't assume that your students really understand any sort of rate intuitively - that has to be part of the training that you're giving them!
So, each type of pecan has a price per unit weight (rho) and each bag of pecans has a weight (W). Only at this point do we have a price (P): the cost of a bag is the product of the price per unit weight and the weight.
I called the price per unit weight rho, which seemed about as good as any symbol. It's a cost density, in a way. Anyway, it's the concept, rather than the notation, that's super-important here.
Hey, did you notice how the units told you exactly what to do there?
I mean, what else could you do to find the price from the price per unit weight?!
Let's shift this pecan business over to electrostatics:
| Quantity | Gravity | Electricity |
| Field (gen. by point mass/charge) | ||
| Force (between points masses/charges) | ||
| Potential (near Earth vs. due to point charge) | ||
| Potential Energy (near Earth vs. between point charges) |
That's a mouthful of physics right there! We'll come back to potential on another day, but the big idea to communicate is that:
The electric field is the force per unit charge, just as the pecans have a price per unit weight.
You don't know the price of a bag of pecans until you know its weight. Plenty of the information that goes into determining the price is already there, though, in the price per unit weight. The shipping, growing, and labor costs are all right there (and they pretty much are all per weight costs!), but there's one critical piece of information missing: how much are you buying?
Once you know the weight, the price is the product of the weight and the price per unit weight.
The same goes for the electric force. The electric field at a point in space is the result of the influence of all of the charges in the area (technically, in the universe) - their sizes and layout in space. That's a big amount of information, but you can't have a force until there's a charge put into that location.
Once you know the charge that you're putting at some location in space, the force on it is the product of the charge and the force per unit charge at that location in space.
That sentence is pretty awkward, so we name the "force per unit charge" electric field, and it becomes:
Once you know the charge that you're putting at some location in space, the force on it is the product of the charge and the electric field strength.
It seems a little awkward, but we've actually been doing it for some time. The lovable old g is the gravitational field strength (near the Earth's surface). How do you determine the gravitational force (weight) on something? Well, you don't know until you know its mass, but information about the Earth's size and mass is packed into g. Take the product of the gravitational field strength and the mass and you get... mg! Same deal, different symbols.
Wednesday, April 13, 2011
Let me tell you about a student
Her name was Michele Dufault, and she was my student in her first physics class, which was also my first year teaching (though I don't think that I admitted that at the time :) ).


Michele was brilliant - quick, accurate, intuitive, tenacious: everything you'd want in a student. She was also everything you'd want in a person - generous, kind, happy: a treasure to know.
She went on to Yale (no surprise), where she was a physics and astronomy major (no surprise) who helped her classmates (no surprise) academically and just as a friend. She was loved by everyone she knew (no surprise), played a mean sax (no surprise) in the Yale Precision Marching Band (a name she undoubtedly got a giggle from, and relished the fun), and was working on a NASA Drop team (no surprise) at 2:30 in the morning (no surprise) when an inconceivable tragedy happened. It's no surprise that none of us that knew her will ever forget Michele.
We are the poorer for having lost Michele.
Tuesday, April 12, 2011
Varsity Guessing
Two of the AP Physics students and I were off playing with the jazz band at the U Delaware jazz festival last Friday, so I left the remaining folks to do some Fermi problems.
In addition to finding a flashlight that was lost in a huuuuuuuge box of packing peanuts early in the week, they came up with this estimate of the amount of land area allotted to each person in the world (well, really, the number of people per square km):

The guess is pretty close. There are a few wonky estimates (fraction of the Earth that's land and size of the Earth), but they more or less normalize to give a pretty close answer, which is pretty much the idea of a back-of-the-envelope calculation.
It's not about super-accuracy, but about finding the right order of magnitude for the answer, which they rocked.
Saturday, April 9, 2011
Blast From the Past #2: The Mirage That Wasn't
If you haven't seen this mirage generator, you should!
It's always a hit with my classes, and the analysis has some surprising depth to it. A couple of my students in honors physics last year had the idea to blow this up, maybe even to a human sized version!
There were several great sticking points here, both in the analysis of the optics (both the top and the bottom of the thing are curved mirrors) and in the engineering. It took some time to figure out whether you're seeing a virtual image of a real image or a real image of a virtual image or... Even figuring out whether the observed image is from the top or bottom mirror is quite an issue.
They figured out these optical issues quite nicely:

The real show was in the engineering: figuring out how to build a parabolic or spherical form, and what the different effects of the two would be, was the first hurdle.
They did an awesome job demonstrating spherical aberration diagrammatically:

This told them that they'd need to modify the spherical mirrors of the demo (they figured out that they were spherical with some arc length measurements and tricky geometry).
Determining what material to use for the reflective surface was also a challenge. They started with a proof-of-concept model, somewhat larger than the original, but not near the intended scale. They went through mylar, plastic, and a few other materials, and settled on cutting small sections of flexible mirror and gluing them to the smooth surface of the model.
The whole idea of proof-of-concept is one of the great things here: they're doing real work, which means that you don't exactly know how it'll come out, so showing that it's possible is (economically, effort-, and time-wise) bright - you don't want to waste a huge chunk of time on something that clearly can't work (though it's only clear after the fact!).
Ultimately, the focus wasn't crisp enough to form any sort of credible image, but they used a ray box to investigate exactly how the rays were traveling - close to convergence, but not close enough to see an image. They demonstrated the success of the geometric design, and pinpointed the issue in surface material/design.

...did I mention that only one of these students had studied optics? (He took physics the year before, which covers optics, and then took honors physics the next year)
It's always a hit with my classes, and the analysis has some surprising depth to it. A couple of my students in honors physics last year had the idea to blow this up, maybe even to a human sized version!
There were several great sticking points here, both in the analysis of the optics (both the top and the bottom of the thing are curved mirrors) and in the engineering. It took some time to figure out whether you're seeing a virtual image of a real image or a real image of a virtual image or... Even figuring out whether the observed image is from the top or bottom mirror is quite an issue.
They figured out these optical issues quite nicely:

The real show was in the engineering: figuring out how to build a parabolic or spherical form, and what the different effects of the two would be, was the first hurdle.
They did an awesome job demonstrating spherical aberration diagrammatically:

This told them that they'd need to modify the spherical mirrors of the demo (they figured out that they were spherical with some arc length measurements and tricky geometry).
Determining what material to use for the reflective surface was also a challenge. They started with a proof-of-concept model, somewhat larger than the original, but not near the intended scale. They went through mylar, plastic, and a few other materials, and settled on cutting small sections of flexible mirror and gluing them to the smooth surface of the model.
The whole idea of proof-of-concept is one of the great things here: they're doing real work, which means that you don't exactly know how it'll come out, so showing that it's possible is (economically, effort-, and time-wise) bright - you don't want to waste a huge chunk of time on something that clearly can't work (though it's only clear after the fact!).
Ultimately, the focus wasn't crisp enough to form any sort of credible image, but they used a ray box to investigate exactly how the rays were traveling - close to convergence, but not close enough to see an image. They demonstrated the success of the geometric design, and pinpointed the issue in surface material/design.


...did I mention that only one of these students had studied optics? (He took physics the year before, which covers optics, and then took honors physics the next year)
Thursday, April 7, 2011
Time to Bounce
I usually begin reflection with an investigation of the full-length mirror.
This year, we prefaced that with the question "How does reflection work?" They grouped, I gave them a rubber ball, and they went "to the boards!"
I was mostly looking for the law of reflection, and I got that from many:
 Another couple of groups did the same sort of thing, but bounced light off of a mirror, with the protractor vertical, measuring the incident and reflected angles.
One group set up so that they measured the horizontal distance of the initial, final, and bounce points - doing a slick end-around on the sine function!

Almost everyone measures the angle between the "mirror" and the path the first time out, which isn't what we usually do (the angle between the normal and the path is more useful, but that doesn't happen until we get to refraction). No worries - the concept's there.
 Evaluating the limitations and implications of your model, on the first day in a new topic? How much more do you want?!
While the law of reflection was nominally what I was "after," a great deal of other discoveries were made and shared with the class.


This year, we prefaced that with the question "How does reflection work?" They grouped, I gave them a rubber ball, and they went "to the boards!"
I was mostly looking for the law of reflection, and I got that from many:
- This group rolled the ball off of a meterstick and traced the initial, final, and bounce points. They then used a protractor to determine that the pre-bounce angle equals the post-bounce angle.

One group set up so that they measured the horizontal distance of the initial, final, and bounce points - doing a slick end-around on the sine function!
- This group looked at reflection off of a curved surface (a flexible meterstick), and used the ball to simulate it. They picked up on some good trends, though they communicated more verbally than they left on the board. We'll get to reflection off of a curved mirror in a few days, but it's great that we're noticing already that it's not really any different than reflection off of a flat mirror (or anything else)!

Almost everyone measures the angle between the "mirror" and the path the first time out, which isn't what we usually do (the angle between the normal and the path is more useful, but that doesn't happen until we get to refraction). No worries - the concept's there.
- This group did a very good job comparing the differences between the ball model and the light model: mostly, it's about the effects of gravity on the ball. Under most circumstances, gravity's influence on light isn't noticeable, but there are notable (and awesome) exceptions, of course. The first group above also noticed a difference in the speed of the ball after the rebound, which they dissociated from light's behavior.

While the law of reflection was nominally what I was "after," a great deal of other discoveries were made and shared with the class.
- This group figured out the law of reflection and noticed some things about the transmission and reflection of light by paper.
- This group initially thought that the mirror might make light spread out (because the spot of light on the mirror from the flashlight was smaller than the spot on the wall after the reflection), but then realized that it only appeared to do that - a laser beam didn't spread at all. The reason? It was right there in the ray diagram the whole time: the flashlight's beam spreads out naturally, and the reflection had caused the path to lengthen, so the mirror hadn't actually done anything!

- This group came up with the law of reflection (with a snazzy diagram) and also accessed some previous information about color, and why different objects are different colors. Even better, they were able to use the law of reflection and some ray tracing to show why letters can appear reversed in the mirror. Several groups noticed it, but they were able to put the pieces together to figure out why.

- Finally, this group (which has been doing very well with chains of reasoning) took a tree-type approach to organizing their knowledge about light. It wasn't what I had in mind, but they were getting good work done, so I let them see where it went. I'm glad that I did: they were able to jump ahead a day and determine the difference between specular (mirror-like) and diffuse reflection! There are diagrams of each off to the left side.

Subscribe to:
Posts (Atom)