Showing posts with label chains. Show all posts

Monday, November 5, 2012

A Practicum I Can Believe In

I've had some difficulty coming up with a good end-of-term practicum for the physics class for a while. This year, we put motion up front (CVPM and CAPM, all graphical analysis) and then went into oscillations (this used to be our first topic).  In oscillations, I've traditionally looked at period/frequency and amplitude, oscillation graphs, using proportional reasoning to solve problems, and qualitative restoring/driving/damping forces.  Proportional reasoning is something that this crew needs to work on in practice, so much of the year is topics that yield to it fairly well.

There have been several benefits to changing the order, though:
- the oscillation graph analysis seems to come just after they cover it in Pre-Calculus, so that saves me a lot of headache
- I can add motion analysis (where's the acceleration the highest?, find the max v from the position graph, etc.) that I couldn't do before
- the reasoning goes down better after they've done a lot of it in CVPM and CAPM, even though it should've been better to start with the easier reasoning here. It probably has something to do with their familiarity with speed vs. their unfamiliarity with period

Another benefit is that I can put together a robust practicum that uses both CAPM and OPM:
  • On the day, I will set up a ramp of unknown length.  There will be a pendulum at the end, oscillating perpendicular to the track.
  • I will let them observe the pendulum in motion.
  • I will demonstrate for them, three times, the cart starting at rest at the top and traveling freely to the bottom.  I will tell them the length of the track.
  • I will assign each group a number of oscillations - the pendulum must complete this number of oscillations between the time the cart is released and the time that the cart gets to the end, and the pendulum must collide with the cart as it reaches the end
  • They need to have a procedure ready to determine how far up the track the cart needs to be released in order for these things to happen.
I let them work for a couple of days in groups, with a pendulum and a 1.2 m cart track. They need to develop and test their method so that it can work in any situation that I give them. 

I give them a packet with several pages: one for outlining a plan of attack (which they need to revise, if that plan changes), and several pages for completing each sub-task. Identifying that they need to determine how long the cart will have to travel, and that they need to measure the period of the pendulum and use the given number of cycles to find that time, is one example of a sub-task here. 

Students tend to be bad at laying out an abstract 'path' through a problem, especially if there's unknown information there. It's a tricky issue to tackle, but requiring these kinds of tasks of the students is certainly part of the equation. It's basically the same thing that I'm trying to address with the chains of reasoning exercises.

I laid out that structure on the first day, and students jumped into the problem at different spots, and most figured out a couple of sub-tasks at least.  There was a lot of average velocity vs. final velocity confusion, as is typical for these students.  On the second day, I had them start by writing out a list of the sub-tasks that they had identified - this is the "flow" of problem-solving that I'm trying to help them with. Most were good at this point, even though most groups hadn't figured out how to accomplish all of the sub-tasks yet. Here are the summary boards: interestingly, the first section was able to parse the task very well, but the second section had a great deal of difficulty understanding what the task was, which numbers were measurements and which were calculations, which variables explicitly affect their calculations (and should be measured, like the amount of time for the cart to go down the track) and which implicitly affected it (like the angle of the ramp, which affects the acceleration, but which doesn't appear in their calculations).


For the practicum itself, I'm using my 5 meter (!) air track :)

Monday, July 2, 2012

Chains of Reasoning: Standing Waves and Tension

I'm clearing out a few "meant to" posts from the year.  Here's a chain of reasoning problem I had kids do about a slinky hanging from the ceiling. I asked this as the 'advanced' question on their big waves assessment, and we came back to it in groups the next day. Students were asked about what would happen to the frequency, wavespeed, and wavelength of the waves from the top of the slinky to the bottom, and then to draw a standing wave diagram to reflect that.  I prefaced it with a question that elicited from almost everybody that the tension in the slinky was greatest at the top (almost 100% success even though they never studied forces - you just have to ask it specifically for them to realize it).

Since most had trouble with the question, I wanted them to work through it, rather than just forget it and move on.

The whiteboards are below. I was very particular with them writing down all of their reasoning - mostly "how do you know that's true?" and "what did you observe or assume to get to that?".  If I stayed on them, they did well and their answers were all correct! It's a year-long process to get them to internalize that process. It's not that they don't have the ability, but being a true self-critic is much more difficult than giving up.

 Hmmm... I can't get this one rotated - Blogger issue.  The original's fine!


Wednesday, December 7, 2011

One of my favorite demos

I love the demonstration of two-source interference of sound waves - two speakers and a sine wave generator is all it takes to get one of those moments that kids remember for a long while after the course is over (now, if we can just get them to remember why it happens!).

The echoes in my lab aren't too bad, and we can actually map an interference pattern reasonably well, in large areas.  At some point, I'd like to try this in a big space and have them mark nodes (quiet points) and antinodes (loud points) with cones or something, and see if we can recreate the classic illustration.

In the meantime, we mapped out a few points that were relatively easily found:

At this point, we already knew all about order lines and how these loud and soft points came to be; we had analyzed a diagram of the interfering waves, determined where constructive and destructive interference were happening, and noticed the pattern in the 'lines' of nodes and antinodes (and even brought those shapes back to the base definition of a hyperbola!).

This was their first chance to apply that to a live problem: what's the frequency of that annoying hum that I'm playing through the speakers, anyway?  Are these measurements all that we need to determine that?  After all, there's nothing about time here at all, so determining the frequency seems daunting at first.

"What order line is that first soft point on?" is the real catalyzing question that I ask the groups a few minutes into their whiteboarding, if they haven't figured out how to apply the two-source model yet.

From there, there are a few steps of reasoning, some triangle manipulation, and some unit conversions needed.  The triangles and unit conversions shouldn't be an issue at this point, though they still are for some that haven't reached an unconscious competence level.  These assumed skills can really derail you. Especially if a problem is already difficult enough to tax your faculties to the max to begin with, adding a protracted wrestle with a unit conversion or diagramming effectively is likely to push your brain into a useless fried state (like okra).

Once we've connected that the order number is important, that connects to something about the distances from the speakers to the point, so we need to find those distances, using the Pythagorean theorem:

OK, great, but what does the order number tell us? This is a place where the sound is quiet because there's destructive interference, which happens because the waves travel different distances to get here.  The waves began synchronized, but since they've traveled different distances, they're at different points in their oscillation between high and low pressure (they're out of phase).  At this place, the wave from the left speaker has traveled half of a wavelength further than the wave from the right speaker (that's the .5 in the order number!).  Now we know two different ways to write the difference in travel distances:
 
Now that we know the wavelength, we're all set:
That's quiet a chain of thought there - let's trace the inferences that you have to make to solve this problem:

That's quite a set of inferences and observations, each necessary to solve the problem.  This number of inferences and observations is necessary for many problems that students try to solve, but we don't often think about the chain of logic so literally.  A great deal goes on behind the scenes... or doesn't.  Note too that there's knowledge from previous courses, previous terms and units of this course, and the current situation, but that it all has to fit together; this doesn't happen if students view understanding as disposable.  That sort of mindset is like tying your leg to a tree and trying to go for a run - no matter what direction you go, you can only go so far.

I think that, if students can get comfortable spelling out their reasoning like this, then they can get better at making a linear argument, which is what all problem-solving is - each step must be supported by knowledge or information and must lead to the next step.  Scatter-shot thinking is rampant, and it does not help problem-solving.  Perhaps conscious effort on constructing a "chain of reasoning" can help a student be able to do this type of thinking unconsciously, too!

Saturday, May 7, 2011

What Does That Graph Tell You (Part 2)?

OK, last time we talked about the magnification and image location vs. object location graphs for plane mirror images.  These aren't too bad, because one's constant and the other's linear.  Both have nice domains - there's an image for every (non-negative) object location.

Let's go a set up the ladder, to convex mirrors.  In the hierarchy of optical complication, plane is low on the totem pole, followed by diverging (lenses or mirrors) and then converging (lenses or mirrors).  With plane mirrors, the images are all virtual, upright, the same size as the object, and the same distance behind the mirror as the object was in front of it.  With converging lenses or mirrors, you can get upright, inverted, enlarged, diminished, same-size, real, virtual, or non-existent images.

Diverging mirrors and lenses have a more varied assortment of images than plane mirrors, but are less complex than converging lenses and mirrors.

Let's start with magnification, and let's start with some ray tracing.  Students got into groups and looked at a variety of object placements, determining the locations and sizes of the images with ray diagrams.  All of the images were upright, and all were virtual - that is, all of the refracted rays appeared to come from locations that they, in fact, never came from.  We couldn't project these images on a screen.  It's nice when something's absolute!

Here's the magnification data:


That's not a super-clear trend; it's a complicated relationship, it seems.  Two things can make it easier, though.  Let's think about the vertical intercept.  Remember that the question "what's the vertical intercept" is equivalent to the question "what is the vertical quantity's value when the horizontal quantity is zero?"  In this case:

"What is the magnification when the object is right on the mirror?"

If we include that point, it can help us not only place the curve, but determine what kind of curve it is.  Here, the image is the same size as the object (magnification: 1) when the object's right on the mirror.  This means that it's not a straight inverse or inverse-square function, because those don't have vertical intercepts.  Adding this point will help, but let's think about the other side of the graph, too.

What's the long-term behavior of the graph?  The question here is: "what happens to the vertical quantity when the horizontal quantity gets very large?"  Here,

"What happens to the magnification when the object gets far away from the lens?"

Looking at the furthest objects away, the ray tracings start to show the images getting smaller and smaller, closer to zero.  There's a horizontal asymptote here, because the graph won't ever cross that axis.  If it did, that means that the image will be upside down, but all of our images are upright. 

Check out the graph, now with intercept value and another point further away:

Trend looking a bit more clear?  ...it'll be something like this:
That function is approaching zero as that image gets really far away.  Not linear, but not too bad.

The image distance vs. object distance graph is a bit more complex.  In the first place, the values are negative (that's the easiest mistake to make here!), because the images are virtual.  Here's a bit of data:


The intercept?  Well, what's the image position when the object's right on the mirror?  It's not hard to try it out.  When you do it, the image is right, there, too: at position 0 when the object is.  That's a vertical intercept of zero, and it adds to the picture.

Looking at the furthest objects away, the ray tracings start to show the images getting closer and closer to the focus.  What's it like when the vertical variable keeps getting closer and closer to some value as the horizontal one keeping increasing?  That, my friends, is a horizontal asymptote, and we have one at f.   Remember that f is a negative number for diverging mirrors (and lenses)!

Put it all together, and what do you get?

Should you be able to just draw that off of the top of your head?  Probably not.  Should you be able to reason through it, step by step, and piece that together one bit at a time, thinking about each step individually and logically?

You bet.

Wednesday, May 4, 2011

The Ball, She Rolls...

Here's a great old AP problem for putting together some pieces:

A solid sphere of radius R and mass M is initially at rest in the position on an inclined plane, such that the lowest point of the sphere is a vertical height h above the base of the plane.  The sphere is released and rolls down the plane without slipping. The moment of inertia of the sphere about an axis through its center is 2MR2/5.   Express your answers in terms of M, R. h, g, and the angle.
a.         Determine the following for the sphere when it is at the bottom of the plane:
      i.  Its translational kinetic energy
      ii. Its rotational kinetic energy


Let's see, let's see...

OK, there's one connection: we can express one kinetic energy (rotational or translational) in terms of the other, through that wonderful pivot:
This only works for us when we're in that enviable "rolling without slipping" condition.  This is a cool connection, and super-useful, but it's old hat for us at this point.

What about the other kinetic energy?  Well, we could work the pivot the other way, or... think about it a little!  It started with some energy: mgh.  We just solved to see that some fraction of that (about 28%) is invested in making the sphere roll.  Where's the other five-sevenths?  

It didn't turn into pumpkin pie, I'll tell you that.  This is where the kids were champs today.  Below, you see them solving for the rotational KE  - the one that they solved for first.  After that? 

Boom. Answer.  
 
No prevarication, no lengthy algebra.  "Duh, it's the rest."  That's good physics thinking.

Never forget that the math is just another way to write down reasoning.  

If you forget that, then you're just pushing letters.

Next part:
b.         Determine the following for the sphere when it is on the plane.
      i.  Its linear acceleration
      ii. The magnitude of the frictional force acting on it

There's again a connection between rotation and translation, and this time it's between the acceleration and angular acceleration:

There was a bit more algebra here, but... did there have to be?

...

Think about it for a second.  Cheat a bit: look at the answers, and think again.

We already know that the kinetic energies are proportional to the height change from top to bottom, and we also know that gravity causes the ball to move (put the rotational axis on the point of contact between the ramp and the ball if you don't believe me) and that static friction causes it to rotate.

Here are the hardest links in the chain:

- Each kinetic energy increases at a constant rate (with respect to distance), because the forces doing the work are constant and the angle between the force and displacement is constant.
- Because the kinetic energies increase at a constant rate, the energy that ends up being 2.5 times the other (5/7 mgh versus 2/7 mgh) must increase at 2.5 times the rate.  That is, the net force down the plane is 2.5 times the friction force.
- A tiny bit of algebra or (better) some thinking about the fractions that the KE split into will reveal the forces (net force and the friction force).  Each is a fraction of the weight's component down the hill: mg sin(theta).

No, it's still not done.  Yes, this is too much for a problem that you only get 15 minutes for on a stress-filled AP exam day.  Boo, College Board.


The solid sphere is replaced by a hollow sphere of identical radius R and mass M. The hollow sphere, which is released from the same location as the solid sphere, rolls down the incline without slipping.
c.         What is the total kinetic energy of the hollow sphere at the bottom of the plane?
d.               State whether the rotational kinetic energy of the hollow sphere is greater than, less than, or equal to that of the solid sphere at the bottom of the plane. Justify your answer. 

I'm guessing that c. is just there to clue us in if we haven't been thinking all along (instead, being mindless algebra drones).  From a test pedagogy standpoint, I don't like this - the AP exam tends to lead students by the nose, rarely requiring them to really put together any sort of chain of reasoning.  It makes the problems easier to score consistently, though, which is (I'm sure) the purpose.

d. is a good one, though.  There are a couple of steps in the chain, which is a rare treat for the AP.

- The mass in a hollow sphere is, on average, further from the axis than in the solid sphere.
- The rotational inertia of the hollow sphere is greater than that of the solid sphere.
- If the two balls were rolling at the same speed, the hollow one would have more rotational KE, but the same translational KE.
- The two balls must, however have the same total KE at the bottom (mgh!).
- The hollow ball must therefore have a great fraction of its total KE as rotational KE (and less as translational, so it's going slower).

Try a race!  Bigger and more hollow will slow down a ball; racquetballs lose to pool balls and marbles!

Tuesday, April 19, 2011

What Does That Graph Tell You? (Part I)

It's a bit of a dirty secret: students can plot points, find different trendlines on their calculators, label axes (if you harangue them) and produce graphs.

Wait, that's not the secret part.  This is the secret part:

Many students don't know what their graphs mean!

This isn't just a problem of graph interpretation (a post for another day?), but it's a serious problem for graph construction.  If you don't know what you're saying, how can you say it?
The more fundamental issue, IMHO, is that many students don't even think that graphs and diagrams and equations actually say anything!

What other explanation can there be for the number of silly graphs, diagrams, and equations that all of us teacher types see?  ...did you really mean that the car is speeding up (from your acceleration and velocity vectors) and slowing down (from your values of velocity)?  ...did you really mean that the object accelerates (because you drew a diagram showing unbalanced forces) and that it doesn't accelerate (because your Fnet equation = 0)?  ...did you really mean that the gravitational force increases (like your graph does, uniformly) as you move away from the Earth's surface?
In most cases, I argue that the students don't really mean most of these things, but instead that they're not attributing meaning to the graphs, diagrams, and equations that we get them to draw.  Why do we harp on them about these?  

Graphs, diagrams, and equations are the most important and useful tools for constructing understanding, not just for communicating it.

Teachers and scientists know this, because we know how to use them, but it has to be part of the process to not only make the students draw these things, but to try to get them in situations where they have to use these in conceptually deep ways.  They don't see the value until they... see the value!  It's easy to give this short shrift, but it's vitally important not to.  Until then, they're checking off boxes - going through the motions.

We're working with optics in physics now, so we warmed up with a couple of easy graphs: magnification (M) vs. object distance (d_o) and image distance (d_i) vs. object distance (d_o) for planar mirrors.  We've ray traced and shortcut, looked at images and fields of view, figured out the necessary length for a full-length mirror, and this is a bit of a review (we've been doing convex mirrors for a couple of days) and a wrap-up in disguise.

Together, on the board (not always the best approach, but we were a little pressed for time this day), we figured out how to translate these conceptual sentences into graphs:


"The image is always the same size as the object."

There are actually a few places to trip up here.  There's hidden reasoning that you can't gloss over, if you want to really have the tools to tackle harder situations.

The image is always the same size as the object.
The magnification (the ratio of image height to object height) is always 1.
For every value on the horizontal axis (object distance), the vertical axis (magnification) has a value of 1.
The M vs. d_o graph is a horizontal line.

 Let's try a bit harder one:

"The image is always the same distance behind the mirror as the object is in front of it."

 There's a bit more reasoning to do here:

The image is always the same distance behind the mirror as the object is behind it.
The image distance is the same "number" as the object distance.
The image distance is the opposite (times -1) of the object distance, since the images are behind the mirror.
For every horizontal (d_o) value, the vertical value (d_i) is the same value, but negative.
If the object's right up against the mirror, so is the image, so the point (0,0) is part of the graph.
The d_i vs. d_o graph is a downward sloping line (slope -1) with an intercept at the origin.


Are these really "simple" graphs? Well, if you think about all of the (mostly unstated) reasoning that goes into them, you start to see why they can be difficult for students.  Remember that most students don't have a real understanding of what the slope, vertical or horizontal intercept, or vertical or horizontal asymptote really mean!  They can draw them and point to them on the graph, but they walk into physics without much of an idea at all of what they actually tell you, much less how to translate some physical conceptual understanding into a graph by using those features of the graph - we (and they) have to put some time and effort into figuring out how these are just different representations of the same information.  Once they've done that, it opens up huge new worlds and gives them tremendous reasoning power that they don't even know exist.

Monday, April 18, 2011

Fields: Mrs. and Electric

The electric field and electric potential are easily the most difficult subjects that I teach each year in the honors physics class.  They're conceptually more difficult than anything in the AP Mechanics C class, too, I'd wager.

The root issue is that, by the time we're to electric potential, we're about two levels away from reality (energy's not real, and V is the potential energy per unit charge) and and three levels from student experience (... and all of this electron and proton business is somewhat on the small side). 

Fortunately, a good study break is all we need.  Let's surf on over to ohnuts.com and grab some pecans!  You know, for sandies.
Ah, yes... it's a tale of two pecans.  Well, maybe two bags of pecans.  You see, I have a bag of cinnamon pecans (bag A) and a bag of regular pecans (bag 1).  Which one cost more?

...

...

...well?

That's not fair of me, of course.  You don't know which cost more until I tell you the weight of each bag.  The price listed on the website, then, isn't really a price - it's something more abstract.  It's the price per unit weight.  The "per" part, even in this mundane example, is the hard bit.  We spend a whole year on "per" - it's called calculus.  

Don't assume that your students really understand any sort of rate intuitively - that has to be part of the training that you're giving them!

So, each type of pecan has a price per unit weight (rho) and each bag of pecans has a weight (W).  Only at this point do we have a price (P): the cost of a bag is the product of the price per unit weight and the weight.
I called the price per unit weight rho, which seemed about as good as any symbol.  It's a cost density, in a way.  Anyway, it's the concept, rather than the notation, that's super-important here.

Hey, did you notice how the units told you exactly what to do there?
I mean, what else could you do to find the price from the price per unit weight?!


Let's shift this pecan business over to electrostatics:
Quantity Gravity Electricity
Field (gen. by point mass/charge)
Force (between points masses/charges)
Potential (near Earth vs. due to point charge)
Potential Energy (near Earth vs. between point charges)

That's a mouthful of physics right there!  We'll come back to potential on another day, but the big idea to communicate is that:

The electric field is the force per unit charge, just as the pecans have a price per unit weight.

You don't know the price of a bag of pecans until you know its weight.  Plenty of the information that goes into determining the price is already there, though, in the price per unit weight.  The shipping, growing, and labor costs are all right there (and they pretty much are all per weight costs!), but there's one critical piece of information missing: how much are you buying? 

Once you know the weight, the price is the product of the weight and the price per unit weight.

The same goes for the electric force.  The electric field at a point in space is the result of the influence of all of the charges in the area (technically, in the universe) - their sizes and layout in space.  That's a big amount of information, but you can't have a force until there's a charge put into that location.  

Once you know the charge that you're putting at some location in space, the force on it is the product of the charge and the force per unit charge at that location in space.

That sentence is pretty awkward, so we name the "force per unit charge" electric field, and it becomes:

Once you know the charge that you're putting at some location in space, the force on it is the product of the charge and the electric field strength.

It seems a little awkward, but we've actually been doing it for some time.  The lovable old g is the gravitational field strength (near the Earth's surface).  How do you determine the gravitational force (weight) on something?  Well, you don't know until you know its mass, but information about the Earth's size and mass is packed into g.  Take the product of the gravitational field strength and the mass and you get... mg!  Same deal, different symbols.

Thursday, March 31, 2011

Chains of Reasoning: Static Electricity #2

Ahh, Volta's Hail. It's my favorite static electricity demo. It really has it all: conduction, polarization, charge induction, attraction and repulsion, grounding...

If you're not familiar with it, here's the setup (image from www.winsco.com):

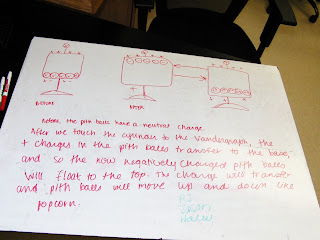
The top plate is put in contact with a Van de Graaff generator, and the conductive pith balls are resting on the bottom plate.  After that?

Let's warm up first, just like my kids did last week.  They broke into groups and each tried to come to agreement on one of the conceptual questions from the text (Giancoli) that I had given them for homework.  In the past, I have given these short shrift, but they can be a valuable part of your teaching arsenal, if you let them be.  I do clicker questions and conceptual ranking tasks in class, but I had always shrugged them off for HW before.  Anyway, this warmup worked really well for one section, and really well for two groups in the next section, but the other groups hadn't done their homework, and...  well, you know how well that goes.

The questions (paraphrased) and the whiteboard solutions:
  • If a plastic ruler is rubbed with cloth, it can pick up small pieces of paper.  Explain why, and why this doesn't work as well on a humid day.

  • What balances the repulsive force between the leaves of a charged electroscope?

  • Explain why clothes that have just come out of the dryer can sometimes stick to you.

  • When a charged plastic ruler picks up small pieces of paper, occasionally one will stick to the ruler and then quickly jump away.  Why?

The honors classes haven't done as many reasoning chains, and the results are certainly mixed here.  There are all the classics: the insufficiently justified, the over-written, the under-written, etc.  Some of these are about communication and learning what's really telling the story, and some represent holes in the conceptual understanding ("But I know the answer!" We all know that having the answer doesn't necessarily mean having the understanding.  They haven't all gotten the message, but we're getting there.)

The chains that we did last class and the conceptual homework have, however, delivered far greater understanding than what I've done in the past.  All of that demonstration, lecture, etc. gave them the sense that they knew what was going on, but...  this year, they're so much stronger with their conceptual understanding.

The difference really became apparent when we went to Volta's hail.  I laid out the scenario: the materials that the apparatus is made from, what I'm going to do, etc., but did not demonstrate and did not tell them what would happen or indulge their questions.  Get in groups, get on that whiteboard, and figure it out.  This part of the cycle I've done before (at least two years).  It's always a colossal bust.  Almost no groups figure out the complex set of things that are going to happen. 

This year, though... all of the groups eventually "got it," only about half went significantly down a blind alley (and they only needed a small prompting question from me to get them back on track), and they really discussed the concepts like folks that knew what they were talking about... ...because they did!

Here are a few of their whiteboards.  It was great seeing them move from their gut reactions (usually just that the pith balls would move up to the top plate) on to making a complete and correct prediction.  It's especially awesome that their understanding and reasoning process was able to overcome their initial guesses without any intervention from me at all!


These aren't bad at all, and I think that most of the omissions here are communication-oriented rather than about gaps in understanding.  Here's a fuller chain:
I will, though, give a video of the demo in action.  If you don't use it in class, I'd consider it, because it's really slick and is one of the few really active electrostatics demos.