Tuesday, November 29, 2011

SBG: Changes for the Winter Term

An informational post, mostly for the benefit of students in my courses:

This winter, we'll be implementing a few changes in our standards-based grading system, in order to streamline the reassessment system and reflect the larger number of standards assessed in the second term.
  • Reassessment requests must be made through this Google form: Reassessment Form.
    • The reassessments, at least at the beginning of the term, will be given on Mondays, Wednesdays, and Fridays (let me know if there's a scheduling issue for you)
    • You need to complete the reassessment form by the previous M, W, or F; for example, if you'd like to reassess Monday, you need to complete the form by the previous Friday.
    • The form asks about the preparation that you have done in order to earn reassessment. Corrections are, as always a minimum, and you need to bring the written work that you have done to prepare for the reassessment.
  • The grading scale for standards will be a little more detailed this term, adding 'half levels' between NP and De and between De and P, in order to have the grade give a finer level of detail about your understanding.
    • A: Advanced
    • Pr: Proficient
    • P-: Proficient Minus
    • De: Developing
    • D-: Developing Minus
    • NP: Not Proficient
  • As there are more standards this term, a single NP will only limit your overall grade to a maximum of C+, rather than C-. Any scores below P will still limit your grade to a maximum of A-.
For full details, check the SBG page on wikiphys.

Sunday, November 20, 2011

Capstone 1: Final Paper

Alex has finished our first capstone of the year.  This is also the first post for CapstoneLearning.org; great analysis, Alex!

Abstract:

In this paper I explore the physics of the computer game Osmos.  It was my goal to see how accurately Newton’s laws applied to this game.  I captured video of the game and used Logger Pro to analyze the physics of how an object propels itself by expelling some of its mass in the opposite direction.  I discovered that impacts between random objects have perfect conservation of energy; when the main mass controlled the player moves conservation is not conserved.  In that situation, the player is given approximately four to five times the amount of energy dictated by Newton’s laws to make the game easier.

Wednesday, November 16, 2011

Three Representations

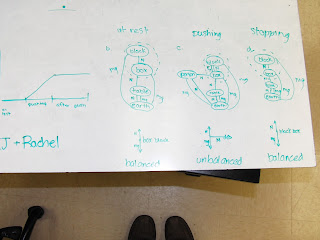
Today the honors physics classes took their first crack at connecting three of the four representations of interactions: system schemas, free-body diagrams, and motion graphs (v vs. t in particular here).  Along with net force equations, these will be the basis of most of the rest of the year!

We had some great whiteboard meetings as we split into five groups to construct our representations and then made sure that all of each group's representations agreed in each situation.  This is good practice for looking at your own work - multiple representations not only give you multiple avenues to attack a problem, but also let you check yourself!

I encouraged them not to write these down on the sheets that I gave them with the setups, so that they can use them as independent practice later, checking back to the whiteboards for verification afterwards.

For each situation, the students evaluated each representation while the box was at rest, being pushed (and speeding up), and after it is released (after having been pushed).

The four situations were:
A rubber-bottomed cardboard box with a block inside it, on a rough floor.
A cardboard box with a block inside it, on a rough floor.
A cardboard box with a block inside it, on a smooth floor.
A cardboard box with a block inside it, on a perfectly frictionless floor.

 
A follow-up task for my students:

Draw v vs. t graphs for each of these four situations on the same set of axes, assuming boxes of equal weight and push forces of equal and constant size.  Here's a template, along with a color-code, ready for magic markers!


Along the way, we had a great discussion about what happens to our system schema if we split the box and the block inside it (leading us to our first encounter with static friction!), and about what we can't tell about the motion from free-body diagrams (like... the direction of the motion!).

Thanks to Kelly for the great springboard to this one!

Saturday, November 12, 2011

Capstone Project 2 - Comments Wanted!

Kawala has submitted her draft of a capstone project on roller coasters. 

The draft is available here, and she'd love your thoughts!

Friday, November 4, 2011

How Good Is That Number?

When we calculate anything, we're always modeling - we're making assumptions and approximations, and our measurements are always inherently uncertain to some degree.  Our calculation must therefore be viewed with an understanding of its limitations and biases (not the colloquial term implying that there was an agenda, but rather any sort of consistent skew to the results due to some physical mechanism that wasn't accounted for).

One experiment that we did to determine the speed of sound a few days ago is a great case study for talking about error analysis. 

The Goal: We were trying to determine the speed of sound in air.

The Setup: Students spread out across a large field, at known distances from a student with a baseball bat and ball.  The student tossed the ball into the air and hit it.

The Measurement: Students started their watches when they saw the ball hit the bat and stopped them when they heard the impact - the travel time delay and the distance can then be used to determine the speed of sound.

Sources of Error: Again, there's a difference between everyday use of 'error' and scientific use; we don't mean 'mistakes' - if you made a mistake, then you need to fix it.  We're talking about consequences of our modeling assumptions and unavoidable measurement uncertainty.

In this experiment, two big sources jump out at us, and illustrate very nicely the two main forms of experimental error that students are likely to encounter:
  • Timer error - every time you start and stop the watch, there's some uncertainty in that measured time interval.  You could have started or stopped a little too late or early, and it's impossible to tell which happened in any given measurement, just based on that one time.  This is a random error source, because it could make your measurement either too high or too low; it generally serves to scatter your data - some points are a little high and some a little low, but the trend is unaffected.
  • Reaction time - this one's more subtle here, and a diagram really helps to illustrate its presence in this case:
          The subtle part is is the difference between the two events.  We saw the impact coming - he tossed the ball into the air, and we could anticipate the impact, so the beginning of the time interval came as absolutely no surprise to us.  The end of the interval, however, was subject to our reflexes; you can't hear the ball until the sound gets to you, so there's no way to anticipate the moment at which you should stop your watch.  This tells us that the measured time intervals will all be too long - that's a systematic error source, because it skews all of our data in the same direction, and has an effect on our average value. 

Effects of the error sources:  This is the most important part of the error analysis, because it gives us information on how we should trust our final calculated value.  In this case, we should expect our calculated speed to be lower than the true value.  We could quantify how much longer, but that's a bit deeper than I'm interested in going with this physics class.  If we can qualitatively analyze the effects of error sources, then I'll be thrilled!
  • The reaction time issue will cause our times to be uniformly too long, which will cause the speeds to be too low.  This is a systematic effect, and we should expect the average value to be lower than the true speed of sound.
  • The timer error will scatter our values, but not affect the average value; some will be too high (because the times were too low) and some too low (because the times were too high), but there's no effect on the average speed.


Now This Is a Great Design

I usually begin our discussion of waves by tasking the students to design an experiment (as a class) to measure the speed of sound in air.  It's a backdoor way into experimental design, error analysis, and rate analysis, rather than really particularly wave-focused.  There are a variety of factors that make this difficult, not the least of which are the high speed of the wave (necessitating large distances) and the issue with measuring an event at a distance (made necessary by the large distance).

One of the slickest ways to get around this is by synchronizing watches, spreading out over a distance, and stopping the watches as each person hears a lour sound.  The differences between positions of the timers and the differences in times can be used to determine the speed - most easily by fitting a line to the position vs. time data, where the slope will give the speed, magically using all of the data in a single calculation!

A very creative design this year came from a couple of groups, actually:
  • Stand some distance away from a wall
  • Clap
... I've heard this one before, up to this point.  Generally, the problem comes when students try to measure the delay of that echo, which is really short.
  • Clap again, when you hear the first echo
  • Repeat, repeat, repeat...
  • By counting claps and timing, say, 50 of them, determine the travel time for each echo.
That's a slick design, and applies some of the good measurement techniques that we've learned to apply to timing oscillations - nice work! It takes a few cycles to get your clapping tempo to match the travel period, but after you're synched up, you can take data on this pretty easily.

Our data:
  • Average time of 13.43 seconds for 50 clap cycles (51 total claps!)
  • Distance from the wall: 42.8 meters
There's an easy mistake to be made in the analysis, which a diagram will sort out:

The distance traveled during the time between claps is twice our measured distance; you have to make sure that the time and distance that you use to calculate the speed are for the same motion!

With an average travel time of .2686 seconds, and a distance traveled of 85.6 meters, our calculated speed of sound is... 319 meters per second!  That's pretty good for a really low-tech method, I'd say.

Thursday, November 3, 2011

Post-game Reassessment: Instant Feedback

A few days ago, I posted about our first use of Frank Noschese's system for instant post-assessment feedback.  The highlights:
  • After finishing the assessment, students go (with paper in hand, but not pencil) to one of the exhaustively completed keys around the room
  • Students pick up a green pencil and mark on their papers: what they were thinking while doing any analysis that came out incorrect, what they can do better next time, and even alternate ideas for analysis if theirs was already correct, but not the same method(s) that I used
  • Students hand in the paper to me, I grade them, record the grades and feedback, and return them as usual
From my point of view, students are looking at their own work right in the moment, so they have immediate buy-in and a fresh memory of what they were thinking while doing the problem, so it's much easier for them to identify their errors in thinking (rather than their errors in doing) than it is for me to try to guess what they were thinking, given only what they did.  Writing their own feedback also helps them have automatically meaningful input for future reference.  I add in anything that I think that they're still missing, but they're doing most of the work here - as it should be!  Learning, unfortunately (for efficiency, fortunately for fun!), isn't something that anyone can do for someone else.

Well, those were my thoughts and hopes.  The next class, I asked students to give me some of their feedback, to see if they saw it as I did.  From their papers on assessment day, I saw a surprising depth of self-reflection and it seemed (from my POV) to be successful.  From their point of view:
  • "I thought it helped me to understand problems/errors I made while the problem was still fresh in my mind.  It was Good + Useful!"
  • "I thought what we did helped a lot because it showed me what I need to work on for the test."
  • "I think the green pencil was helpful because it allowed me to learn from my mistakes."
  • "It helped me understand some of it, but it was a little difficult to know if I would get partial credit, like with tangent lines, but it did help me understand what went wrong" The small wrinkle that they were drawing tangent lines by hand to determine velocity from a curved position graph meant that some students had difficulty judging what was close enough.  The partial credit thing is really ingrained in them - focus on the learning, not the points!
  • "Good, so you know right away what you did wrong and fix it."
  • "Was not helpful because I did not understand what to do."
  • "This method was kind of helpful because it forced me to look at my mistakes but sometimes I don't know what my mistakes were."
  • "I liked it because it helped me learn what I did wrong."
  • "I liked the idea.  My thought process was fresh in my mind."
  • "Now I know what I was thinking on the test.  This is positive so I realize what I was thinking during the test."
  • "I liked it! It helped, I think, and I could see my mistake as soon as it happened and know where I went wrong."
  • "For the first side the numbers were slightly different but the method was the same, so it confirmed my procedure.  The other side showed how I messed up the equation slightly."
  • "I liked doing the green pencil because it was right after the assessment so I knew what I was thinking while taking the assessment."
  • "I thought that going back and making corrections on the assessment immediately after taking it was very helpful.  I could figure out what I did wrong and then use the corrected version to look over and study from.  Also, I know what types of mistakes I made, so I know what to watch out for in the future."
  • "I liked it.  It was good to see my mistakes right after."
  • "I liked the idea a lot, but it didn't really help me since I had the answers right."
  • "It helped me learn what I did wrong to see the work."
  • "It helped me pinpoint what I needed to work on."
  • "It helped. When I got my quiz back, I recognized what I was thinking when I took it."
  • "I think it was nice because I could look at the correct answer and see why it was wrong instead of you just declaring it was wrong and not showing us exactly."
  • "It was hard to tell exactly what you did wrong or if you needed more information than you had." My key was very verbose - some kids did ask if they needed to show all of the work that I did. 
  • "It was good feedback."

Tuesday, November 1, 2011

Habits of Great Problem-Solvers

We're wrapping up CAPM (constant acceleration motion) in honors physics, and one of the biggest ideas is determining the direction of an object's acceleration.  It's very important once we start moving into force analysis, because it tells you about how the forces acting on an object are related, and sometimes tells you the direction of a force that you couldn't determine any other way (static friction, I'm looking at you!).

We took a second to stop and collect our list of ways to determine the acceleration of an object:
  • From the x vs. t graph: is the slope increasing or decreasing?  You have to be careful here to differentiate between getting steeper vs. flatter (which tells you about speed) and whether the value of the slope is increasing or decreasing (going from a zero slope to a negative slope is decreasing).
  • From the v vs. t graph: is the slope positive or negative?  There's your acceleration sign direction, too.
  • From a diagram: is the object speeding up or slowing down, and what direction is it moving?  The combination of the acceleration and velocity directions determines whether something's speeding up or slowing down, so you can work backwards to find the acceleration direction from the directions and relative sizes of the initial and final velocities.  If you know that it's moving left and speeding up, you know that the acceleration's left as well.  If it's moving left and slowing down, then the acceleration is in the direction opposite the velocity (so a is to the right, in this case).
  • From the x vs t graph: is the graph concave up or down?  That is, does it open upward or downward?  Positive accelerations have concave up position graphs.
We applied this to an easy example using a ramp and a Pasco Visual Accelerometer.  These are pretty neat little boxes that produce a green arrow or a red arrow to one side or the other, based one the direction in which it is accelerating.  For some reason, kids will believe that little computer box with all of their hearts.

The second challenge was a little tougher: I roll a cart up the hill with the visual accelerometer on it, and let it go up to the top and then come back down.  I asked the students to predict the direction (or directions) of the acceleration, and to defend their answers with at least two pieces of evidence (they have four possible lines of inquiry from our four methods above!).

This is one that always has the potential to stump my students.  Detaching the directions of velocity and acceleration (indeed, differentiating that velocity and acceleration are actually two different things!) can be tough, as can detaching speed from velocity.

Which direction is it moving? You can't tell by this acceleration reading!
They did very well with it, though, with most groups coming to the correct answer rather quickly and confidently.  A big part of this seemed to be their use of these multiple lines of evidence to back up their decisions.  Every approach that you take to a problem will give you an answer.  Whether that answer's worth much?  It's hard to say, if that's all you have to go off of.  If you can attack the problem from multiple directions, then you can really have some confidence in it.

I definitely had groups draw iffy motion graphs during this.  Most groups, however, as they used the diagrams and graphs to try to come to the same answer over and over again, noticed when one representation gave a different answer than the others, and were able to flip that velocity graph or look at the starting position more carefully.

This is what great problem-solvers do - they use multiple avenues to address a problem, letting the results of each one inform the others.  It's not really a linear process, but an attack from multiple angles, until you break through, and then a mopping-up of all of those open threads, in order to make sure that everything line up as it should.

Once again, we see that:

Great problem solvers don't always get it right the first time - they just catch their own mistakes, so that the first answer that you see from them is right.

 This idea about the non-linearity of problem solving doesn't just apply to problem-solving, though: the whole web of knowledge in your head really is a web.  If you only connect each piece of knowledge to the next in a single chain or ladder, then it's difficult to tell when a thread breaks.  After all, you'll always get an answer.

If, however, each piece is connected to many others, then one strand breaking isn't an issue, because you have several other ways to make that connection.  This is really the secret of complex problem-solving, and pretty much the definition of knowing something cold (unconscious competence!).

Here's a web that I threw together for my knowledge connecting the kinematic quantities:
The most fundamental thing that makes my understanding deeper than the honors students' understanding at the moment is that I just know some more connections than they do (so far).  Making this web as rich as possible is really your job as a learner.  When teachers bemoan "surface understanding," cramming, and answer-hunting, it boils down to a difference in the process for a student - that student's goal directly impacts the level of understanding that he/she'll get out of the course.

So, how about it?  Are you trying to get someone to tell you "the path to the answer," or are you building your own sprawling web of highways?